
Appearance
Analytics
The Analytics page provides metrics and charts to help you understand workflow activity, completion rates, and trends over time.
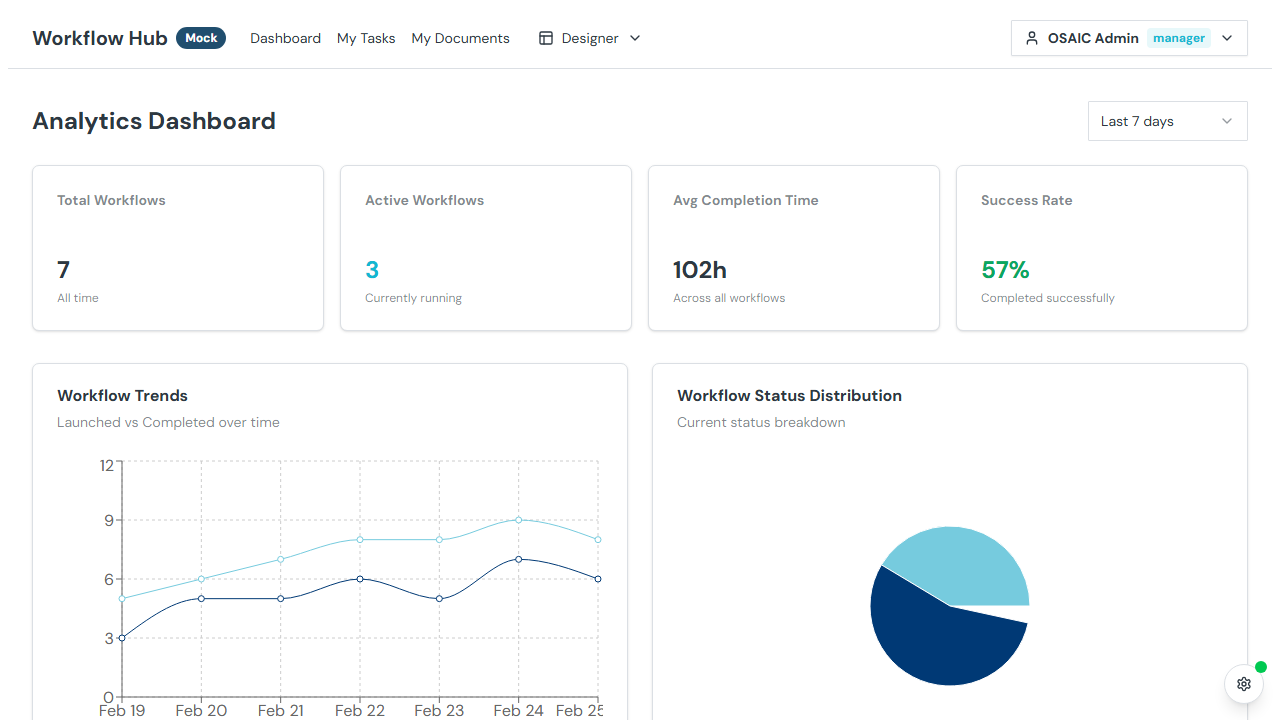
Metrics Overview
At the top of the page, summary cards show key counts:
- Total Workflows — all workflow instances
- Active — currently in progress
- Completed — successfully finished
- Failed/Blocked — workflows with issues
Charts
Workflows Over Time
A time-series chart showing the number of workflows launched and completed over a selected period. This helps identify trends in workflow volume and throughput.
Top Templates
A chart showing which workflow templates are used most frequently. Useful for understanding which processes are most active in your organization.
Time Range
Select a time range to scope the metrics:
- Last 7 days
- Last 30 days
- Custom range — pick specific start and end dates
Task Metrics
In addition to workflow-level metrics, you may see task-level breakdowns:
- Pending tasks — tasks waiting to be started
- Completed tasks — tasks that have been finished
- Blocked tasks — tasks that can't proceed
Tips
- Check Analytics regularly to identify bottlenecks — a high number of blocked workflows may indicate a recurring issue
- Use the Top Templates chart to understand which workflows drive the most activity
- Compare launch vs. completion rates to gauge workflow efficiency